Your Broker’s Net Asset Value Differs From the Fund’s by a Full Percentage Point
Open your brokerage account and look at the net asset value for any ETF or mutual fund. Now look up the same fund's official NAV on the issuer's website. If the numbers disagree by half a percent or more, you are not seeing a glitch. You are seeing the difference between a historical artifact and a real-time approximation—and that gap can cost you money if you trade without understanding it.
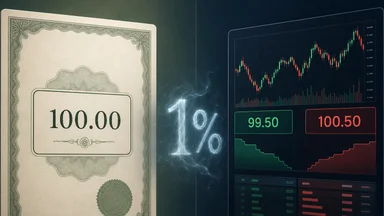
The discrepancy rarely signals fraud or even sloppy data. It is a structural feature of how funds price their holdings and how brokers display prices. Two different clocks run the calculation, and each has its own rulebook. The fund's NAV is computed once daily after the market close, using the last trade prices of its underlying securities, adjusted for any fair-value pricing on illiquid holdings. Your broker, by contrast, shows an indicative NAV based on the last trade price of the ETF itself, which includes the bid-ask spread and the market maker's margin.
This article walks through the mechanics: why the gap exists, how big it can get, and what you can do about it. You will not find a conspiracy here, but you will find a series of contract terms and regulatory rules that, taken together, create a persistent 100-basis-point ghost in your portfolio.
The 100-Basis-Point Ghost That Lives in Your Portfolio
Imagine you hold shares of a large-cap ETF that tracks the S&P 500. The fund's official NAV at yesterday's close was $400 per share. At 10:30 a.m. today, your broker's screen shows an NAV of $403.50. That is a gap of roughly 0.9%. If you place a market order based on the broker's number, you might buy at $404 or sell at $402, depending on the spread. The difference between what you expect and what you get is the ghost.
This ghost has several parents. First, the fund's NAV is computed using the last trade prices of its holdings at 4:00 p.m. Eastern. If the market has moved since then, the broker's price reflects current trading. Second, the broker uses the bid price for a sell and the ask price for a buy, while the fund uses the mid-point. Third, trading costs are embedded in the spread—the market maker takes a cut for providing liquidity. Finally, you are looking at stale data from the previous close, which may be hours old if you trade early in the session.
The gap is not constant. In calm markets, it might hover around 0.1% to 0.3%. During volatile sessions, it can widen to 1% or more. For a buy-and-hold investor who trades rarely, the impact is small. For someone rebalancing monthly or trading frequently, the cumulative cost can be significant.
Consider the Credit CARD Act of 2009, which among other things restricts interest charges on paid-off balances. That statute reduced hidden costs for cardholders. Similarly, the NAV gap is a hidden cost that compounds if you ignore it. The difference is that you can manage the NAV gap with a few simple habits, whereas the credit card rule requires legislative change.
Why the Fund's NAV Is a Historical Artifact
The official NAV of a mutual fund or ETF is computed once per day, after the market close. For U.S. funds, that means 4:00 p.m. Eastern. The fund accountant gathers the last trade price for each security in the portfolio, adjusts for any corporate actions, and divides by the number of shares outstanding. The result is the price at which all buy and sell orders are executed for mutual funds, and the reference value for ETF creation and redemption.
Fair-value pricing adds another layer. If a fund holds international stocks that trade on exchanges closed before 4:00 p.m., the accountant must estimate a current value using futures, ADRs, or other indicators. This is required by SEC rules to prevent stale pricing arbitrage. The fair-value adjustment can push the NAV away from the last traded price of the ETF itself, creating a discrepancy that your broker cannot easily replicate.
Fund accountants also apply haircuts to certain holdings per SEC guidelines. For example, a money market fund must value its assets at amortized cost subject to a haircut that reflects credit risk. The haircut reduces the NAV to protect against sudden drops. Your broker's indicative NAV does not apply these haircuts in real time; it uses the last trade price of the ETF, which already incorporates the market's view of the haircut.
Consider the Vanguard Total Stock Market ETF (VTI). Its official NAV is published daily on Vanguard's site. During the trading day, the market price of VTI can trade at a premium or discount to that NAV. The gap is usually small, but on days with heavy volatility or news events, it can exceed 0.5%. If you look at your broker's screen at 11:00 a.m., you are seeing the market price, not the NAV that will be published at 6:00 p.m.
Your Broker's Price Is a Real-Time Approximation
Your broker shows an indicative NAV, often labeled iNAV or IIV (intraday indicative value). This is calculated by the exchange or a data provider using the last trade prices of the ETF's underlying securities, updated every 15 seconds. It is a best-effort estimate, not a firm price. The actual price you get when you trade is determined by the bid-ask spread in the market.
The bid-ask spread is where the ghost lives. When you buy, you pay the ask price; when you sell, you receive the bid price. The difference is the market maker's compensation for taking the risk of holding inventory. In liquid ETFs, the spread might be a penny or two. In less liquid funds, or during volatile periods, the spread can widen to 10 or 20 cents, which on a $100 share is 0.1% to 0.2%. That is on top of any discrepancy between iNAV and the last trade.
Market makers hedge their risk by trading futures, options, or the underlying basket of stocks. They use sophisticated algorithms to keep the ETF price close to the iNAV. Authorized participants—large institutions that can create or redeem ETF shares in kind—arbitrage away large discrepancies. If the ETF trades at a significant discount to NAV, they buy shares in the open market and redeem them for the underlying basket, pocketing the difference. This mechanism typically keeps the gap under roughly 0.5% for most ETFs.
But the mechanism is not instantaneous. During fast-moving markets, the gap can persist for minutes or even hours. If you trade during those windows, you may get a price that differs from the fund's official NAV by a full percentage point. The broker's display is a snapshot of a moving target.
The Haircut That Nobody Talks About
In finance, a haircut is the difference between the current market value of an asset and the value ascribed to that asset for purposes of calculating regulatory capital or loan collateral. The amount of the haircut reflects the perceived risk of the asset falling in value in an immediate cash sale or liquidation. The larger the risk or volatility of the asset price, the larger the haircut. This concept is central to understanding why your broker's NAV can differ from the fund's.
Haircuts apply in several places. When a prime broker lends money to a hedge fund against collateral, it demands a haircut—say, 5% for investment-grade bonds and 20% for high-yield bonds. If the collateral value drops, the broker can liquidate without loss. The same logic applies to ETFs. The fund itself may apply a haircut to its illiquid holdings for pricing purposes, reducing the NAV. Your broker's indicative NAV does not apply this haircut in real time; it uses the last trade price of the ETF, which already reflects the market's assessment of the haircut.
Regulatory capital rules amplify small gaps. Under SEC Rule 2a-7, money market funds must maintain a stable NAV of $1.00, but they are allowed to use amortized cost subject to a haircut. If the haircut exceeds a threshold, the fund must break the buck. For bond ETFs, the haircut on high-yield holdings can be substantial, and the market price of the ETF may trade at a discount to the official NAV as a result.
From Wikipedia: "The amount of the haircut reflects the perceived risk of the asset falling in value in an immediate cash sale or liquidation." This risk is priced into the ETF's market price, but not into the fund's official NAV until the next close. The gap you see is the market's real-time estimate of that haircut.
How to Read the NAV vs. Market Price Dance
To avoid being caught by the gap, you need to watch the right numbers. During trading hours, check the iNAV or IIV for your ETF. Most exchanges and data providers publish this for free. If the market price is above the iNAV, the ETF is trading at a premium; if below, at a discount. A premium suggests high demand or illiquidity; a discount signals selling pressure.
For buy-and-hold investors, discrepancies under 1% are generally not worth worrying about. Over a multi-year holding period, the gap tends to average out. But if you are trading frequently or rebalancing, the gap can eat into returns. Use a Bloomberg terminal if you have access, or free screeners like ETF.com or the issuer's own website. Compare the broker's price to the fund's official NAV from the previous close, adjusted for market movement.
Consider the Department of Labor's 401(k) fee disclosure rule (29 CFR § 2550.404a-5), which requires plan administrators to disclose fees in a standardized format. That rule added transparency but also highlighted hidden costs. Similarly, ignoring the NAV gap can add a hidden drag. The difference is that the 401(k) rule is disclosed in a document you can read; the NAV gap is not disclosed at all. You have to monitor it yourself.
If the gap exceeds 1%, investigate the cause. Is the market volatile? Is the ETF thinly traded? Is there a corporate action or dividend ex-date approaching? The answer will tell you whether to trade now or wait. In most cases, waiting a few hours or until the next day reduces the gap.
The IRS Also Shows Up at Settlement
The gap between your trade price and the fund's NAV has tax consequences. When you sell an ETF share, your gain or loss is calculated based on your cost basis, which is the price you paid—including any premium or discount. If you bought at a premium to NAV, your cost basis is higher, and your taxable gain is smaller (or loss larger). If you bought at a discount, the opposite applies.
The wash sale rule applies to ETF shares just as it does to individual stocks. If you sell at a loss and buy a substantially identical security within 30 days, the loss is disallowed. The IRS treats the premium or discount as part of the trade price, so the wash sale calculation includes the NAV gap. For example, suppose you buy an ETF at a 1% premium to NAV and later sell at a 0.5% discount to NAV, realizing a loss. If you repurchase the same ETF within 30 days, the loss is disallowed, and your cost basis on the new shares is adjusted upward by the disallowed loss. The premium you paid effectively becomes part of the deferred loss.
To manage the tax impact, use specific identification method when selling shares. This allows you to choose which lots to sell, minimizing the tax hit from premium purchases. Track your cost basis carefully, and note whether you bought at a premium or discount. If you reinvest dividends, the cost basis of those fractional shares also reflects the NAV at the time of reinvestment.
Hedge funds and institutional traders arbitrage the NAV gap for profit. Individual investors can at least avoid being the counterparty. By understanding the mechanics, you can time your trades to reduce the spread and the tax drag.
When the Gap Is Negligible or Even Beneficial
Not every NAV gap is a cost. For long-term investors who hold ETFs for years, the gap at the time of purchase or sale is a one-time event that gets swamped by market returns. A 1% gap on a single trade is trivial if the ETF returns 10% annually over a decade. Moreover, if you are a net buyer, buying at a discount to NAV is actually beneficial—you acquire shares for less than the underlying assets are worth. Similarly, if you are a net seller, selling at a premium gives you extra value.
There are also situations where trading despite the gap makes sense. For example, if you need to rebalance a portfolio quickly to manage risk, waiting for the gap to narrow might expose you to greater market losses. In tax-loss harvesting, you might accept a wider gap to realize a loss before year-end. The key is to be aware of the gap and decide consciously whether it is worth accepting.
Some investors deliberately trade ETFs that consistently trade at a discount to NAV, buying them for the potential arbitrage. However, this strategy carries risks: the discount might widen further, or the fund could liquidate at NAV, eliminating the discount. It is not a free lunch.
Three Rules for Avoiding the Spread Tax
First, use limit orders, never market orders. A market order guarantees execution but not price. In a volatile market, you might pay the ask plus a widening spread. A limit order lets you specify the maximum price you are willing to pay or the minimum you will accept. If the gap is too large, your order will not fill, and you can try again later.
Second, trade during peak liquidity windows. For U.S. ETFs, the most liquid time is the first hour after the open and the last hour before the close. During lunch hours, spreads widen. Avoid trading around the ex-dividend date, when the ETF price drops by the dividend amount and the NAV gap can be erratic.
Third, compare your broker's displayed NAV to the fund's official NAV from the previous close. If the gap exceeds 1%, investigate. Is there a news event? Is the underlying market closed? If the gap is due to a temporary dislocation, wait for it to narrow. If it is structural—for example, an ETF that consistently trades at a discount—consider a different fund.
The spread tax is not a tax in the legal sense, but it functions like one: it reduces your return without any corresponding benefit. By following these rules, you can minimize the cost. The goal is not to eliminate the gap—that is impossible—but to avoid being the one who pays it.
Conclusion: A Gap You Can Manage, Not Eliminate
The NAV gap is a structural feature of ETF and mutual fund trading. It arises from different calculation methods, market microstructure, and regulatory rules. You cannot make it disappear, but you can understand its causes and adjust your trading habits accordingly. For most investors, the gap is a minor nuisance, not a portfolio killer. But in a world of thin margins, every basis point matters.
The next time you see a discrepancy between your broker's NAV and the fund's official number, remember: it is not a glitch. It is a signal. Learn to read it, and you will trade smarter.
Disclaimer: This article is for informational purposes only and does not constitute personalized investment or tax advice. Consult a qualified professional before making trading decisions.