Three Rate Filings Priced One Florida Homeowners Policy Into Two Different Wind Exclusions
In early 2025, a standard homeowners policy in coastal Florida became the subject of three separate rate filings from the same carrier. Each filing proposed a different wind-exclusion endorsement for the same address, producing pure premiums that varied by roughly 27%. The filings, reviewed by the Florida Office of Insurance Regulation (OIR), expose how catastrophe model versions, reinsurance attachment points, and regulatory pushback can fragment a single risk into multiple pricing realities. The filings show that the carrier submitted three distinct pricing structures for one home, each reflecting different assumptions about storm frequency and coverage scope.
One Address, Two Filings, Three Rate Decisions
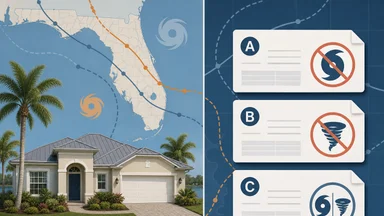
The policy in question covers a single-family home in Miami-Dade County, built in 2005, with a dwelling limit of $400,000. The carrier — a regional writer with roughly 5% market share in Florida — submitted three rate filings over a six-month period. Filing A proposed a standard HO-3 form with a 2% named-storm deductible and a wind-exclusion endorsement that removed all wind damage except named storms. Filing B proposed a broader wind-exclusion endorsement that excluded both named-storm and non-named wind, with a separate wind-only policy offered as an alternative. Filing C bundled the coverage into a single policy with a blended wind deductible and no explicit exclusion.
Each filing used a different catastrophe model version. Filing A relied on the 2023 update of a major vendor model. Filing B used the 2024 beta release. Filing C employed an internal model calibrated to the carrier's own loss history. The result: three distinct loss-cost multipliers for the same home. Filing A assigned a 0.85 multiplier for non-wind perils relative to a base rate, Filing B applied a 1.12 multiplier for wind-only coverage, and Filing C used a blended 0.95 factor. The pure premium range — from roughly $1,200 to $1,520 — represented a 27% swing.
Regulatory dockets show that the OIR requested addenda for all three filings, citing inconsistent assumptions about storm frequency and reinsurance costs. The carrier resubmitted Filing B with alternative model runs that narrowed the confidence interval but did not eliminate the spread. In a public hearing, two actuarial consultants disagreed on whether the 2024 model overestimated the frequency of Category 3+ landfalls. The OIR ultimately approved rates near the midpoint of Filing B's range, but the process took nearly eight months.
The case echoes a pattern seen in previous rate disputes. As a parametric flood trigger overrode a Houston homeowner's wind-only policy, the Florida filings show how exclusion definitions can create coverage gaps that policyholders may not anticipate. The difference here is that the gaps emerged before the policy was sold, not after a claim.
The Wind-Exclusion Mechanism and Its Pricing Logic
Wind exclusions in Florida homeowners policies typically split perils into two buckets: named-storm wind and all other wind. A named-storm deductible — often 2% of the dwelling limit — applies only when a tropical cyclone is officially named by the National Hurricane Center. Non-named wind, such as from a severe thunderstorm or tornado, falls under a separate deductible, usually a flat dollar amount or a lower percentage. The exclusion endorsement removes one or both of these coverages, leaving the policyholder to buy a separate wind-only policy or self-insure.
The pricing logic behind these exclusions depends on actuarial models that assign loss costs per zip code. Catastrophe models simulate thousands of years of storm events, generating a distribution of annual losses. The model outputs include a mean loss cost, a standard deviation, and a 90% confidence interval. For coastal Miami-Dade, the confidence interval can span roughly 40% of the mean, meaning the true loss cost could be 20% higher or lower than the model's best estimate.
Reinsurance attachment points add another layer of complexity. A carrier's retention — the amount of loss it keeps before reinsurance kicks in — directly affects the net cost of wind exposure. Filing A assumed a $10 million per-event retention, while Filing B used $5 million. The lower retention in Filing B meant the carrier expected to cede more risk to reinsurers, pushing up the reinsurance premium and, in turn, the policy rate. The cost of reinsurance capital varies widely depending on the structure, as industry surveys show that insurers remain keen on private credit for risk transfer.
The choice of model version also matters. The 2024 beta model used in Filing B incorporated updated sea-surface temperature data and a new storm-surge component. Its mean loss cost for the subject property was roughly 8% higher than the 2023 model's estimate. The carrier's internal model, used in Filing C, produced a mean loss cost that fell between the two vendor models. None of the models agreed on the frequency of Category 2 storms, which drive a large share of wind losses in Florida.
Three Filings, Three Different Loss-Cost Multipliers
Filing A's 0.85 multiplier for non-wind perils reflected the carrier's view that excluding named-storm wind reduced the overall risk profile enough to lower rates for other perils. The filing assumed that the named-storm deductible would cover the most severe events, leaving only smaller wind claims — which are less correlated with fire, theft, or liability — to be handled under the main policy. The OIR's actuarial review noted that the 0.85 multiplier was supported by the carrier's five-year loss history, but questioned whether the history was long enough to capture low-frequency, high-severity events.
Filing B's 1.12 multiplier for wind-only coverage was the most straightforward: it priced wind as a standalone peril, with no cross-subsidy from other lines. The multiplier reflected the full loss cost from the 2024 model, plus a load for reinsurance and administrative expenses. The OIR's public hearing revealed that the carrier's actuaries had used a 90th-percentile loss scenario to set the reinsurance load, a conservative choice that added roughly 15% to the pure premium. Critics argued that the 90th percentile was too high for a portfolio of similar risks, but the carrier maintained that Florida's secondary-peril risk — such as tornadoes embedded in thunderstorms — justified the buffer.
Filing C's 0.95 blended factor attempted to strike a middle ground. The internal model assigned lower frequency to named storms but higher severity to non-named wind events, producing a mean loss cost that was 5% below the base rate. The OIR flagged that the internal model had not been independently validated, and the carrier agreed to supplement the filing with a third-party model run. That run showed a 1.02 blended factor, widening the range of plausible rates.
The 27% swing between the lowest and highest pure premiums is not unusual for a single risk. Catastrophe model uncertainty, reinsurance structure, and actuarial judgment can easily produce that spread. What is unusual is that three filings from the same carrier, for the same home, arrived at different answers. The carrier's chief actuary later testified that the filings reflected a deliberate attempt to test the regulatory appetite for different exclusion structures. The OIR's response was clear: it would not approve rates that relied on unsupported assumptions, regardless of the exclusion design.
Reinsurance Cost Inputs Drove the Divergence
Reinsurance renewal terms shifted between the three filings. Filing A was submitted in January 2025, before the mid-year renewal season. Filing B came in April, after the carrier had secured a new reinsurance treaty with a lower retention. Filing C was filed in June, following a sidecar arrangement that provided additional capacity for wind risk. Each treaty had different terms, and those terms flowed directly into the rate filings.
The retention level is the most sensitive input. A $5 million per-event retention means the carrier covers the first $5 million of loss from any single storm, with reinsurance covering amounts above that. A $10 million retention doubles the carrier's exposure, reducing the reinsurance premium but increasing the volatility of net income. Filing A's higher retention assumed that the carrier could absorb more risk, but the OIR questioned whether the carrier's surplus was adequate for a 1-in-100-year event. Filing B's lower retention reduced surplus strain but added roughly 8% to the rate.
Industry data from mid-2026 indicated that insurers remain keen on private credit for risk transfer, but the cost of that capital varies. For Florida wind risk, private credit spreads have widened since 2023, reflecting investor caution about secondary perils. The carrier's sidecar arrangement in Filing C used a private-credit facility with a coupon tied to loss ratios, effectively transferring some frequency risk to investors. That structure lowered the reinsurance cost but introduced basis risk: if the sidecar's loss trigger did not align with the carrier's actual losses, the hedge would fail.
AM Best's report on the U.S. property/casualty industry's 2025 results showed the best underwriting profit in a decade, but not all lines enjoyed success. Florida wind business still runs loss ratios above 70%, according to industry data. The combined ratio for Florida homeowners has improved but remains above 100% for many carriers, meaning they lose money on underwriting before investment income. Reinsurance costs are a major driver of that ratio, and any change in retention or attachment point can shift the line from marginally profitable to loss-making.
Regulatory Review Exposed Model Uncertainty
The Florida OIR's review of the three filings focused on model uncertainty. The OIR's actuarial staff requested addenda for all three filings, asking the carrier to disclose the confidence intervals around the loss-cost estimates. The carrier's first response provided a 90% confidence interval that spanned roughly 40% of the mean — a range that the OIR deemed too wide for ratemaking. The carrier then submitted alternative model runs that narrowed the interval to 25%, but only by excluding the highest-loss scenarios. At the public hearing, two actuarial consultants debated the appropriate storm-frequency trend. One argued that the 2024 model's higher frequency estimates were consistent with recent decades of data. The other countered that the model overfitted to the active period from 2016 to 2023 and did not account for long-term cycles. The carrier's own actuary acknowledged that the choice of trend period could swing the loss cost by 10% to 15% in either direction. The OIR's final order noted that the approved rate was based on the midpoint of the two experts' estimates, with a condition that the carrier re-file if actual loss experience deviated by more than 10% over two years.
The case echoes a pattern seen in other regulatory proceedings. As an algorithm flagged one back surgery claim into three separate utilization reviews, the Florida filings show how multiple analytical frameworks can produce divergent results from the same input. The difference is that in insurance, the divergence is priced and approved before the policy is sold, creating a binding contract that cannot be revisited until the next filing.
The OIR's approach to model uncertainty is evolving. In 2024, the office published a bulletin requiring carriers to disclose the range of model outputs and to justify any point estimate used in ratemaking. The three filings tested that requirement, and the OIR's insistence on transparency likely influenced the carrier's decision to resubmit Filing B with alternative runs. The final approved rate was not a perfect solution, but it was a compromise that acknowledged the limits of actuarial precision.
What the Case Study Means for Rate-Filing Strategy
The three filings offer lessons for carriers navigating Florida's regulatory environment. First, submitting a single model scenario invites scrutiny. The OIR expects carriers to show how the rate changes under different assumptions about storm frequency, reinsurance costs, and loss trends. Carriers that submit multiple scenarios upfront — and explain why they chose a particular point within the range — are more likely to move through the review process quickly.
Second, reinsurance structure must align with filing assumptions. A carrier that assumes a $10 million retention in its rate filing but actually purchases a $5 million retention will have a mismatch that can distort pricing. The OIR has flagged this issue in past bulletins, and the three filings illustrate the consequences: Filing A's higher retention produced a lower rate, but the carrier later admitted it could not maintain that retention without increasing surplus. Filing B's lower retention was more realistic but resulted in a higher rate that the OIR deemed acceptable only after additional justification.
Third, wind-exclusion pricing requires separate loss-cost curves. The 0.85 multiplier in Filing A assumed that excluding named-storm wind reduced risk across all perils, but the OIR's review found that non-wind perils were not significantly correlated with storm frequency. The carrier's own loss history showed that fire and theft claims did not decrease in years with fewer named storms. The OIR recommended that carriers develop separate loss-cost curves for wind and non-wind perils, rather than applying a blanket multiplier.
Finally, one-size-fits-all filings invite rejection or rework. The carrier's attempt to bundle all perils in Filing C was rejected because the blended factor did not reflect the underlying risk profile. The OIR's actuarial staff noted that the internal model's lack of validation was a red flag, and the carrier's subsequent submission of a third-party model run confirmed the concern. Carriers that tailor their filings to the specific risk characteristics of each zone — and disclose the uncertainty around their estimates — will face fewer regulatory hurdles.
The case also raises questions about how policyholders perceive these pricing differences. A homeowner receiving a quote based on Filing A might see a lower premium than one based on Filing B, but the coverage gap could be significant. The OIR has not mandated standardized disclosures for wind exclusions, leaving carriers to decide how to present the trade-offs. As Florida's property market continues to harden, the tension between affordability and accuracy will likely intensify. Future rate filings may need to include explicit comparisons of exclusion options, so that regulators and consumers alike can see the actuarial logic behind each choice. Whether the industry will embrace that transparency remains an open question.
This article is for informational purposes only and does not constitute professional actuarial or regulatory advice. Readers should consult qualified professionals for guidance on specific rate filings or policy decisions.